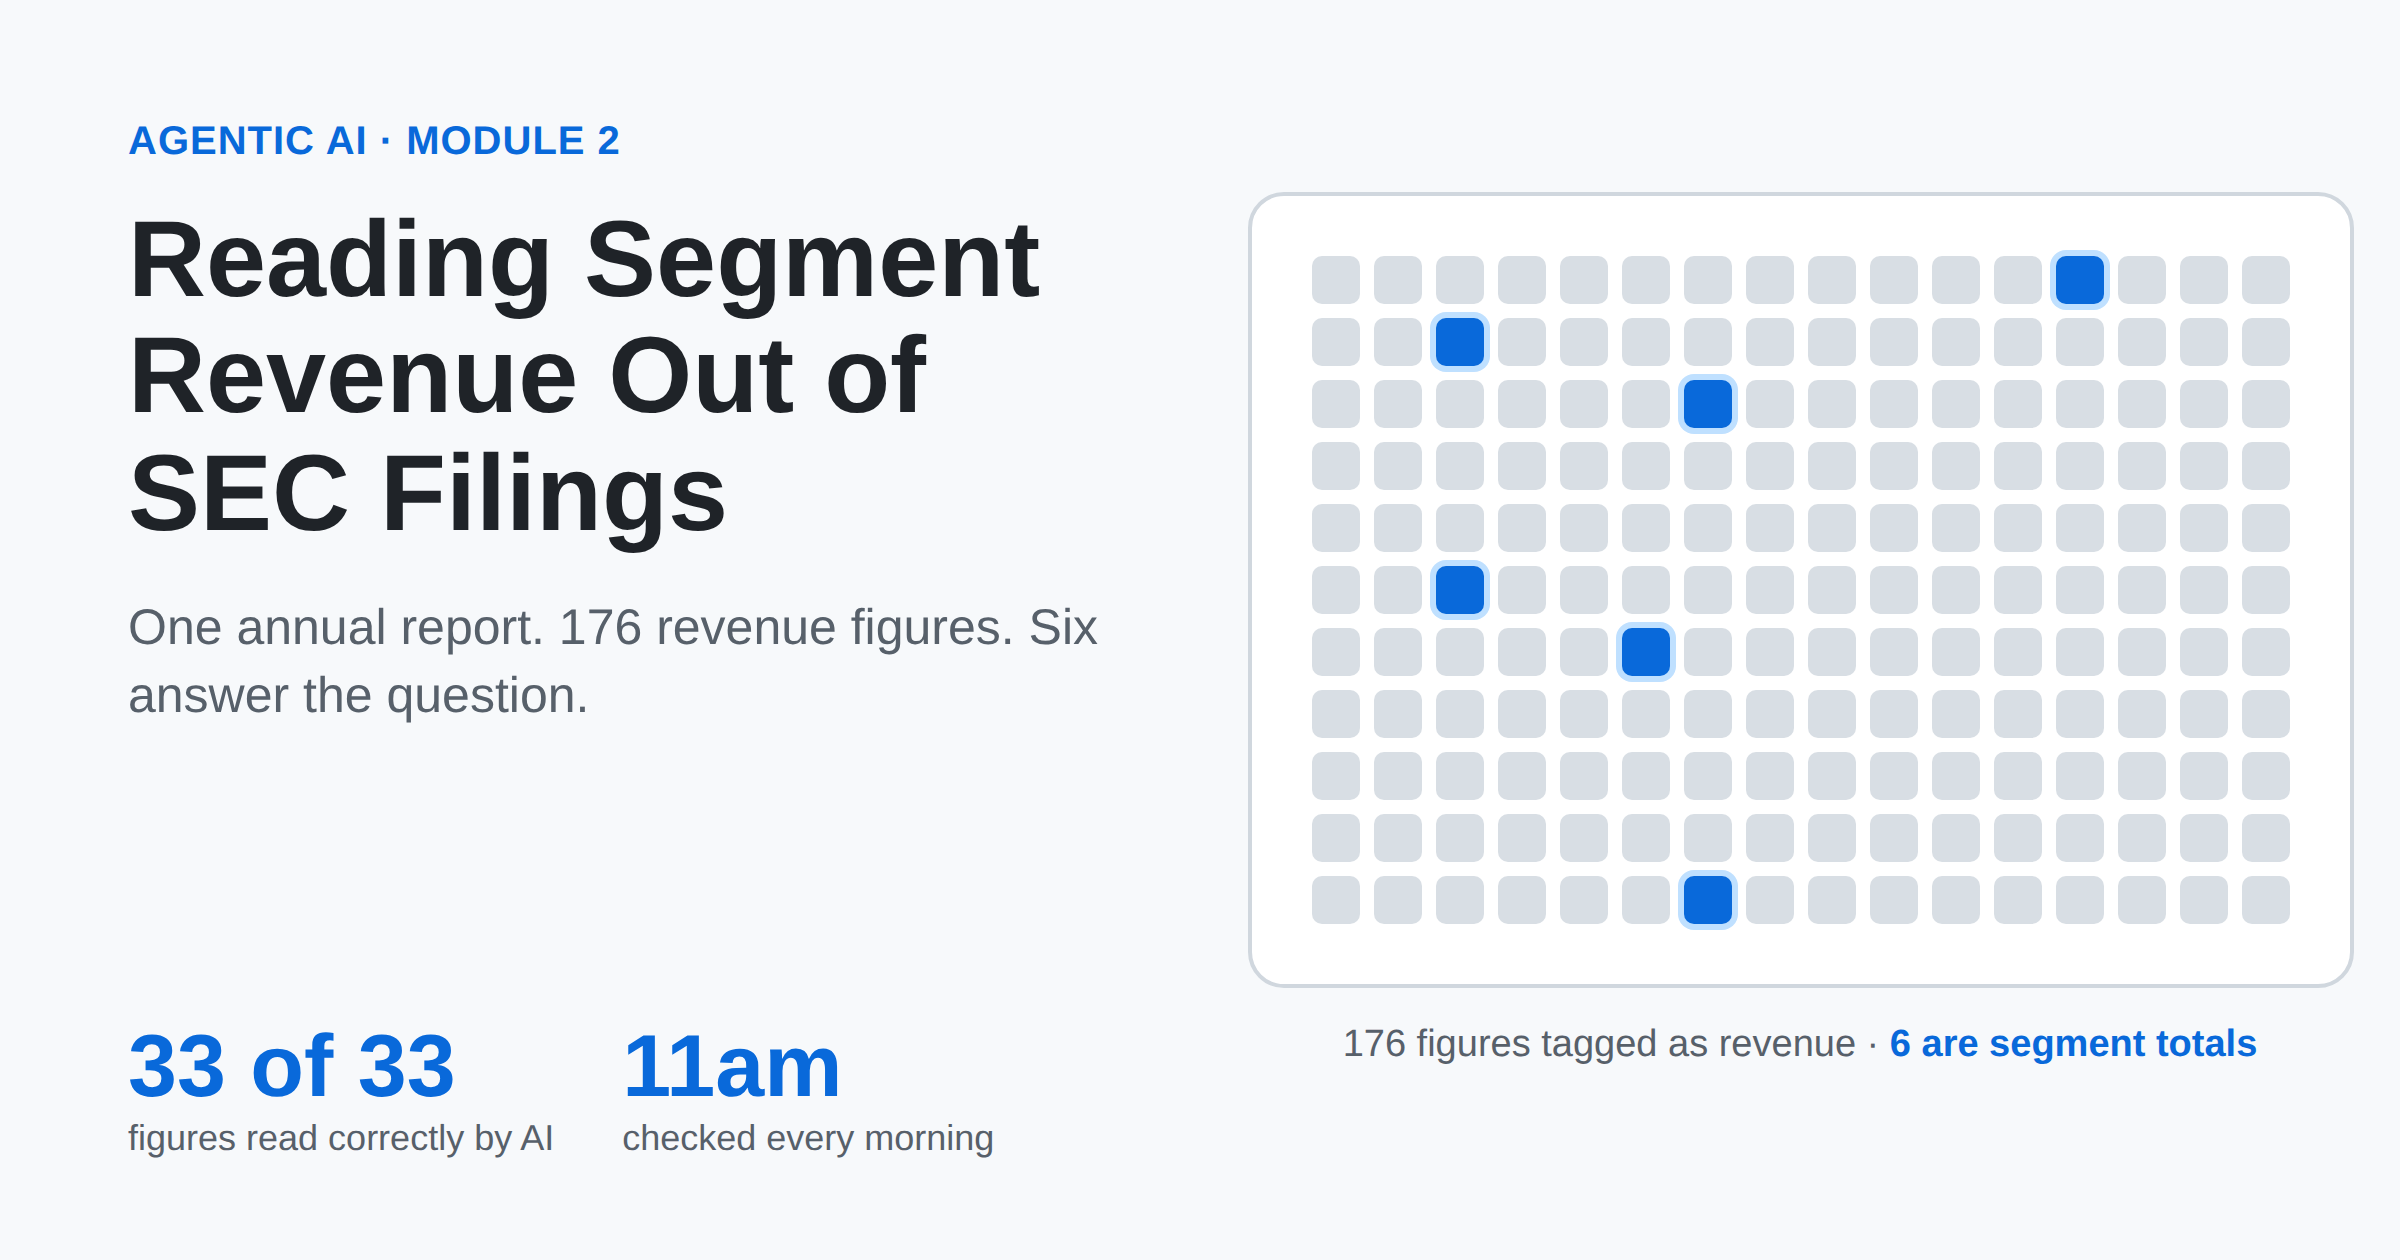
Reading segment revenue out of SEC filings sounds simple. It is not. One annual report from BWX Technologies holds 176 revenue figures. Six of them answer the question I needed answered. The other 170 are correct too. However, they answer a different question.
This post shows how I built a tool that finds the right six every time. Then, each morning, it checks my investment claims against them. It runs by itself at 11am. Here is what it took.
Code: thesis-drift-monitor holds the claims, the checking, and the morning note. sec_data_downloader reads the filings. Both are free and open source.
This is Module 2 of a seven-part series on building an AI research tool in the open.
A note before the numbers. This is a technical project, not investment advice. The claims below are my own test cases for the tool. They are not predictions I am asking anyone to act on, and not recommendations to buy or sell anything. I own shares of BWX Technologies (BWXT) and Sterling Infrastructure (STRL) and may buy or sell them at any time.
Where Module 1 left off
Module 1 read research articles and turned them into claims. Each claim came with a test: what would have to happen for me to admit I was wrong. Six claims survived review. Here is one:
BWXT’s Government Operations revenue grows at least 7% in 2026. Wrong if it comes in below 7%.
That is a statement I can be proved wrong about, which is the point. In other words, it is a test case, not a forecast.
Module 1 could tell me that claim was checkable. BWXT publishes that figure every quarter, and 7% is a clear line. But Module 1 never looked up a single number. Instead, it stopped at “this could be tested.”
Module 2 does the testing: it finds that segment revenue in each filing and checks it against the line.
Why segment revenue is hard to find
The Securities and Exchange Commission (the SEC) runs a free service that returns a company’s financial figures. Also, no key or sign-up is needed. Ask it for BWXT’s revenue and you get one clean answer: $3,198,425,000 for 2025.
But my claim is not about BWXT. It is about one of BWXT’s two divisions, which companies call segments. Segment revenue is buried deeper, inside each filing.
I counted. BWXT’s 2025 annual report tags 176 separate figures as revenue. Six are the segment totals. The rest, for example, are the same revenue sliced other ways:
| Figure | What it measures |
|---|---|
| $2,350,090,000 | Government Operations, total. The one I need. |
| $2,323,608,000 | Government Operations, United States only |
| $2,337,024,000 | Government Operations, work delivered over time |
| $1,796,395,000 | Government Operations, one program inside it |
Even so, all four are real and correctly reported. The second is only 1.1% away from the right answer. Close enough to look right.
Two things with the same name
It gets stranger. BWXT has a segment called Commercial Operations. It also has a product line called Commercial Operations, sitting inside the Government segment.
| Revenue, 2025 | |
|---|---|
| Commercial Operations, the segment | $853,070,000 |
| Commercial Operations, the product line inside Government | $147,138,000 |
Same name. Nearly six times apart. Search for segment revenue by name and you can land on either.
That was the first lesson. You cannot find the right number by its name. You find it by where it sits.
Giving each claim an address
So each claim now carries an exact address in the filing. “Government Operations” is not enough. The address holds the exact label the company used in its tagged data, plus the kind of figure (segment revenue, cash flow, backlog) and the period.
Writing those addresses turned my six claims into eight measurable parts. That is because two claims tested two things at once. First, one tested free cash flow and a profit margin. Second, another tested revenue and a backlog of signed work.
Two of the eight parts turned out not to be measurable from filings:
- A profit margin BWXT defines itself. It appears only in press releases, never in the tagged data.
- The Navy’s shipbuilding plan. It is public and published every year, but as a document on a Navy website, not a filing.
Both are recorded as “check by hand” rather than hidden. After all, a tool that quietly skips what it cannot measure looks more complete than it is.
I also wrote a small script that tries each address against a real filing and reports whether it resolved. It caught three mistakes before anything was built on top of them.
Two roads to the same segment revenue number
A company’s quarterly figure lives in two places on the SEC’s EDGAR website.
Road 1 is the tagged data. Every filing carries hidden labels saying what each number is, which segment, and which period. A script reads the labels and pulls out segment revenue. As a result, you get the same answer every time, with no judgment involved.
Road 2 is the press release. When a company announces results, it files the press release too. That is a table written for people, with no labels at all. So the only way to get a number out is to read it. That is what a language model is for.

The nightly check uses Road 1. Road 2 was an experiment: I had DeepSeek read segment revenue from every press release and checked each answer against Road 1.
Why bother? My design rule from the start was that the AI never does the math. That was a hunch. I wanted to test how far the AI could be trusted with numbers, using an answer key it never sees. For the same reason, the model never sees my 7% threshold. It reads a figure; Python decides what that figure means for the claim.
What it takes to read segment revenue correctly
The AI’s job on Road 2 is small: look at one table and report the segment revenue for each division. Everything around that is ordinary code. In fact, that code is where the work was.
Picking the right segment revenue table
A press release holds about a dozen tables. Before the model reads anything, code must pick the one table that holds segment revenue. I needed five tries.

The second try is worth a closer look. Handed a table with no revenue in it, the model said “none found” instead of guessing. It was right; my code was wrong.
In the end, every try failed the same way. A word cannot tell you which table holds a number. Where the word sits can.
Working out the units of segment revenue
BWXT’s release says 601.3. Is that thousands, millions, or billions? Every segment revenue figure depends on the answer. The page says so somewhere, usually in a note like “(in millions).” I needed four tries here too.

The first try is the one to remember. On both runs, the figures the model read were identical. Only its description of the units changed, and that one word moved the answer by a factor of 1,000.
The model read 905,001 correctly on every single try. Instead, what kept breaking was my code deciding what 905,001 meant.
The check that checked itself
One more, because it is the easiest to fall into. My scoring code compared the model’s answer to whichever tagged segment revenue figure was closest to it. That sounds harmless. In practice, it means the answer key moved to wherever the answer landed. As a result, that version could never report a real mistake.
It also hid something. Companies never file a fourth-quarter report; the annual report covers it. So there is no tagged fourth-quarter figure anywhere. I had to compute it: the full year minus the first three quarters. For BWXT’s Government segment that is 589,148 thousand dollars. The model had read 589,147.
None of these produced an error message. Instead, each produced a number that looked fine. That is the real warning for anyone building this.
The result: 33 of 33 segment revenue figures
I compared segment revenue from the two roads for every quarter back to early 2024, for BWXT and for Sterling Infrastructure. That is 33 figures.
| Outcome | Count |
|---|---|
| Exact match | 14 |
| Match after rounding | 19 |
| Wrong figure | 0 |
“Match after rounding” is not an error. BWXT prints 601.3 million in its press release. The tagged data says $601,291,000. Same figure, rounded. Sterling reports to the thousand dollars, so its figures match exactly. The accuracy is the same for both companies.
The model was handed hard tables. One BWXT release stacks five measures in a single table. “Government Operations” appears four times, beside 601.3, 105.7, 126.5 and more. Even so, it took the revenue figure every time.
This measures one thing: whether the tool reads segment revenue correctly. On the other hand, it says nothing about whether any claim will turn out right.
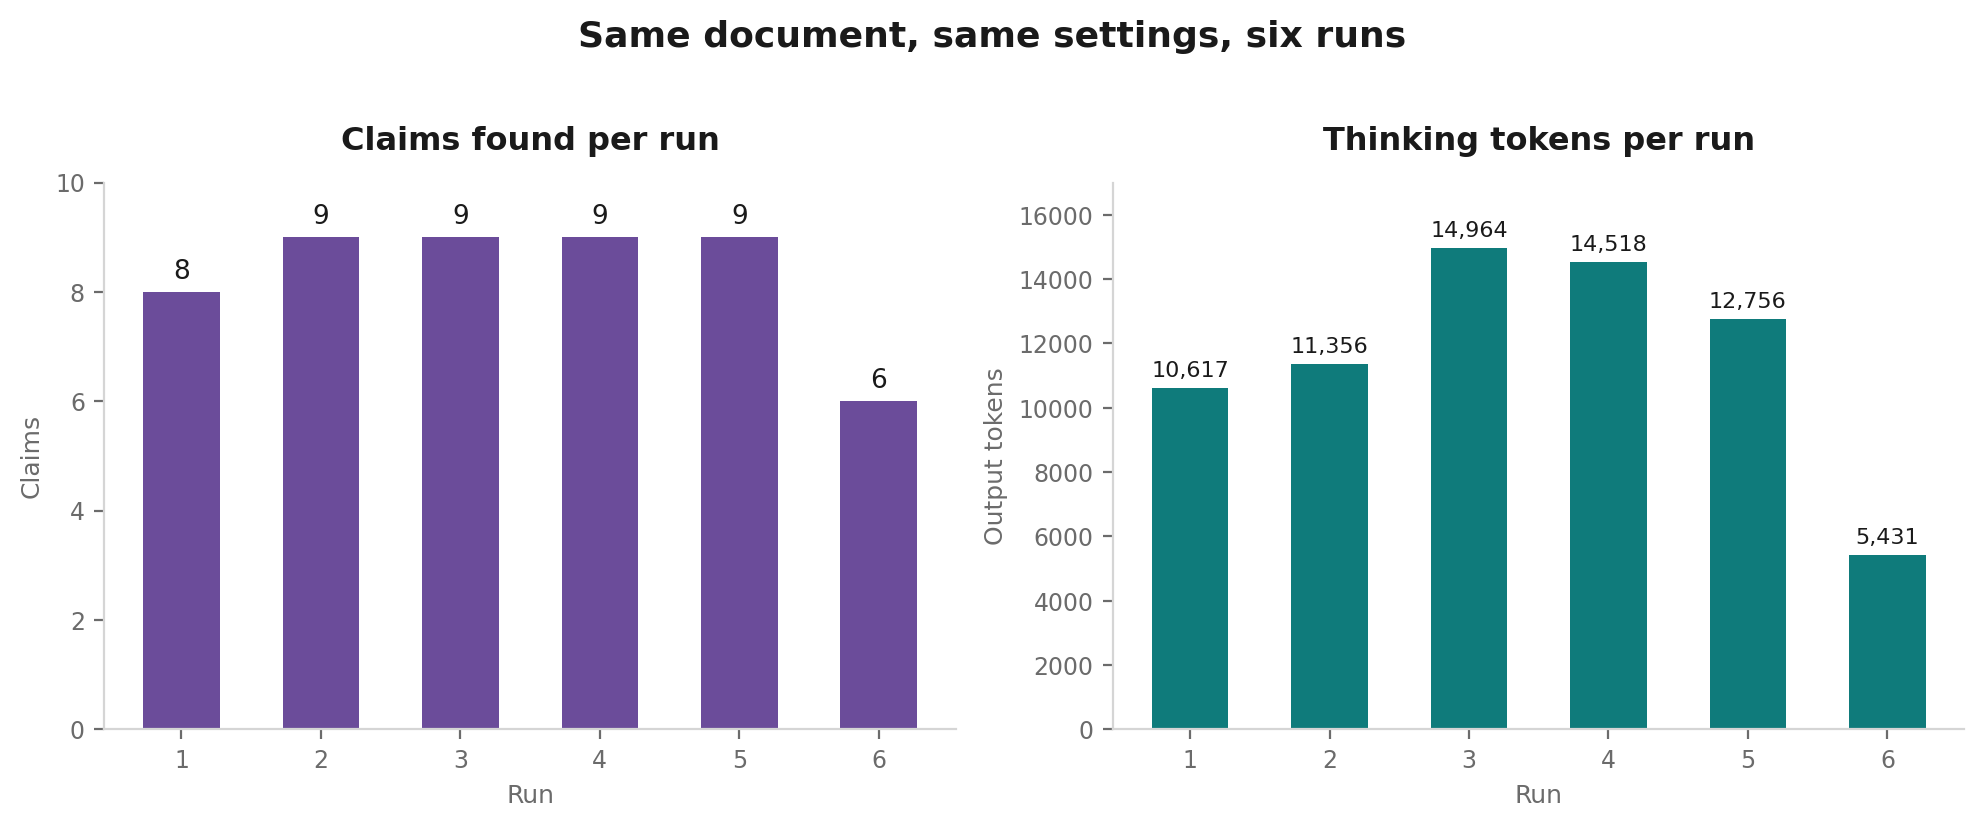
It gave the same answers three times. To be specific, I ran the whole comparison three times. All 99 readings matched. In Module 1, the same article gave six to nine different claims across six runs. The difference is the question. “What claims are in this article?” leaves the model a lot to decide. “Read revenue for these two segments from this table” leaves it almost nothing.
It cost $0.68 in API fees for the whole month, including some Module 1 work. The nightly check itself costs nothing, because it uses no AI.
It checks segment revenue every morning
Every day at 11am my Mac runs the check. It works like DailyBuddy, my earlier command-line agent, except no AI is involved. First, it looks for new filings from each company, reads the segment revenue and other figures each claim depends on, and does the arithmetic. Next, it writes one line per finding to a permanent log. Lines are never edited. If a company restates a figure later, that becomes a new line. The log is a record of what I knew and when.
Then it writes a short note. Today’s opens like this:
Last checked 2026-09-26 05:57 UTC: 0 filings looked at, 0 of them new,against 6 measurable claims.Nothing changed.
That first line matters. A blank note could mean nothing happened or the job crashed overnight. By contrast, stating what it checked makes the silence trustworthy.
Every claim is open, and that is correct
A figure only counts as evidence if it was filed after I wrote the claim. After all, data I already had when I wrote it cannot prove me right. My claims are dated August 18. Both companies report their next segment revenue in early November. So every claim is still open.
But the arithmetic already says something
The check also works out what the rest of the year would need to deliver for each claim to hold. This is arithmetic on reported numbers, not a prediction. Two BWXT claims, same company, very different pressure:
| Claim | Growth so far in 2026 | Second half would need to grow |
|---|---|---|
| Commercial Operations, at least 45% for the year | +92.5% | +18.6% |
| Government Operations, at least 7% for the year | +3.1% | +10.7% |
One claim has room to spare. The other would need its second half to grow more than three times as fast as its first. Neither is settled until the next segment revenue figures are filed. Both will be tested by numbers, not by my mood about them.
A claim of mine that did not say what it meant
The last check before writing found a problem in my own work, not the code.
One of my claims says Sterling’s “signed backlog stays above $4.0B.” Backlog is work a company has signed but not yet done. It hints at future revenue. Sterling reports it three different ways. Its latest quarterly report shows the first two:
| Backlog figure | June 30, 2026 |
|---|---|
| E-Infrastructure segment only | $3.21 billion |
| All three segments | $4.23 billion |
| All segments, plus awards not yet signed (“combined backlog”) | larger again |
My $4.0 billion line sits between the first two. Under one reading the claim is safe today. Under the other, however, it has already failed.
The claim looked precise. It passed Module 1’s review. It still did not say which number it meant. I decided it meant all three segments, since the segment alone had never been near $4 billion when I wrote it. That decision is now written into the claim’s address, with the filing that supports it.
This is a failure Module 1’s checklist did not have: a claim can be testable and still have more than one right answer. It only showed up when something tried to test it.
What this does not show, and what comes next
33 segment revenue figures, two companies, one model, one prompt. Therefore, that is good evidence the approach works on these filings. It is not proof that language models read financial tables reliably in general. I also tested four other companies against the filing reader to see where it would break:
| Company | Worked as built? | What it needed |
|---|---|---|
| BWX Technologies | Built on it | The first version |
| Sterling Infrastructure | Yes | Nothing |
| DoorDash | Yes | Nothing (it reports one segment, so segment tracking adds little) |
| GE Vernova | No | It reports each segment’s revenue two ways, with and without sales between its own divisions |
| Berkshire Hathaway | No | It tags each segment twice, with different figures and different segment names |
Every fix was for the same kind of problem: one figure reported two ways. When the two ways disagree, the tool now stops and asks which one the claim means, instead of picking one.
How this feeds the rest of the series
Module 2 checks claims that settle on a reported number, such as segment revenue. Each later module builds on something made here:
| Module | What it adds | What it takes from Module 2 |
|---|---|---|
| 3. Retrieval | Finding the right paragraph in a 200-page filing | The two measures that could not be read from tags, like BWXT’s own profit margin, need exactly this |
| 4. Tool use | An AI agent that decides which scripts to call, the pattern behind ReAct prompting | The arithmetic scripts built here become the agent’s tools; today plain code calls them in a fixed order |
| 5. More than one model | Real disagreement between different models | Reading a number gave identical answers three runs out of three. Judging whether a news story matters will not be that easy |
| 6. Measuring it | Grading the agent against answers labeled by hand | Here the tagged data was a free answer key. For judgment calls there is none, so I will have to write one |
| 7. The scorecard | Which sources actually helped, after a year | The permanent log started this month. Every line is dated and names its filing |
I also dropped news from this module. Every one of my claims settles on a filing, and filings arrive before the news about them.
The first real test comes in early November, when BWXT and Sterling report third-quarter results. That is when a claim can first hold or fail.
Read segment revenue yourself
You need Python 3 and a free internet connection. No API key is needed for the filing reader. The SEC only asks that you identify yourself.
1. Get both repositories side by side.
git clone https://github.com/psachdev/sec_data_downloader.gitgit clone https://github.com/psachdev/thesis-drift-monitor.gitpip install -r sec_data_downloader/requirements.txtexport SEC_USER_AGENT="Your Name you@example.com"
2. See how any company tags its segment revenue. Pick a ticker, find its latest annual report, then list the shapes.
cd sec_data_downloaderpython sec_cli.py filings BWXT --forms 10-K --limit 1python sec_cli.py segment BWXT <accession> \ --concept RevenueFromContractWithCustomerExcludingAssessedTax --shapespython sec_cli.py segment BWXT <accession> \ --concept RevenueFromContractWithCustomerExcludingAssessedTax --totals
--shapes shows every way the company slices that figure. --totals returns only the segment totals.
3. Check every number in this post.
cd ../thesis-drift-monitorpython verify_post_numbers.py
It fetches each figure straight from the SEC and prints a link to the filing beside it. That way, you do not have to trust my tables.
4. Run the morning check on my claims.
python run_nightly.pypython digest.py
To track your own claims, add them to theses.consolidated.json and give each one an address in theses.addresses.json.
Check your understanding
Why can’t you just ask the SEC for a company’s segment revenue?
The SEC’s easy service returns whole-company figures. Segment figures sit inside each filing, tagged alongside dozens of other slices of the same revenue.
If all 176 revenue figures are correct, what is the problem?
Most answer a different question: one country, one contract type, one product line. The US-only figure for BWXT’s Government segment is 1.1% from the right answer. Close enough to fool you.
Why does the AI never see the 7% threshold?
A model that knows the target can reason its way toward it. Given the number and the line, it might explain why 5.9% is “broadly consistent” with 7%. It reads the figure. Python makes the call.
What does “match after rounding” mean? Is it an error?
No. The press release prints 601.3 million. The tagged data says $601,291,000. Same figure, written two ways.
Why doesn’t any claim show as held or failed yet?
Only figures filed after the claim was written count as tests. My claims date from August 18. The next filings arrive in November.
Why does the morning note say what it checked, even when nothing changed?
So you can tell a quiet day from a crashed job. Both would otherwise look like a blank page.
What does the AI actually do in this system?
Only one thing, and only in the experiment: read segment revenue from one press-release table. Finding the filing, choosing the table, working out the units, and doing the math are all plain code.
Sources
- BWX Technologies 2025 annual report (Form 10-K), filed February 23, 2026
- Sterling Infrastructure 2025 annual report (Form 10-K), filed February 26, 2026
- Sterling Infrastructure second-quarter 2026 report (Form 10-Q), filed August 4, 2026
- SEC EDGAR application programming interfaces
- Module 1: LLM Extraction, Same Document, Six Different Answers
Disclaimer
This is a technical project, not investment advice. The claims here are examples used to test a tool. They are not recommendations to buy, sell, or hold any security, and nothing here predicts performance. I own shares of BWXT and STRL. All company figures come from public SEC filings; check them yourself with the script above. Do your own research, or talk to a licensed professional, before making investment decisions.






Leave a Reply